How to Calculate the Electrical Axis of the Heart on an ECG, Step by Step
By the DecodeMed Team6 min read
Get the RadioAnato AI app, free:App StoreGoogle PlayAbout RadioAnato AI
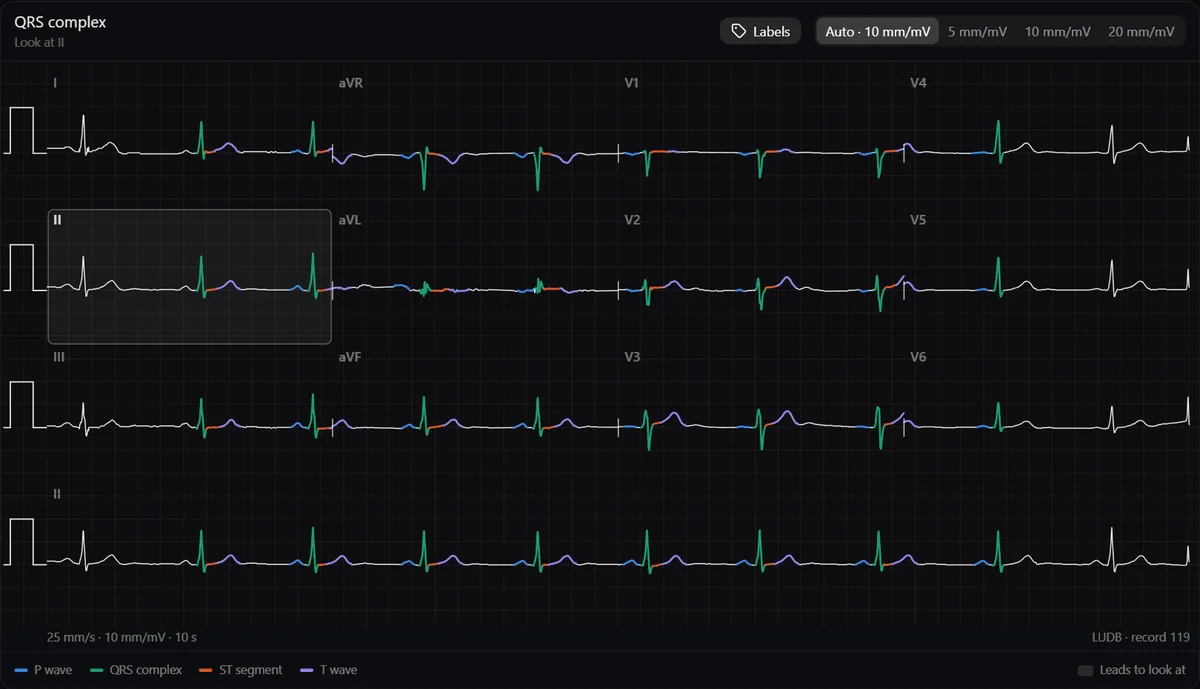
Look at the QRS in lead I and aVF: if both are mainly positive, the axis is normal. If lead I is positive and aVF negative, check lead II: positive means still normal (0 to −30°), negative means left axis deviation. Lead I negative with aVF positive is right axis deviation. The normal axis runs from about −30° to +90°.
What the axis is
The axis is the average direction of ventricular depolarisation in the frontal plane, measured on the hexaxial system formed by the six limb leads: I at 0°, II at +60°, aVF at +90°, III at +120°, aVL at −30° and aVR at −150°. A wave heading towards a lead is positive in it; heading away, negative; perpendicular, equiphasic.
Step 1: leads I and aVF
| Lead I | aVF | Axis |
|---|---|---|
| Positive | Positive | Normal (0° to +90°) |
| Positive | Negative | Check lead II (step 2) |
| Negative | Positive | Right axis deviation (+90° to +180°) |
| Negative | Negative | Extreme axis (−90° to ±180°) |
“Positive” means the QRS has more area above the baseline than below it.
Step 2: lead II separates normal from left deviation
If lead I is positive and aVF negative, the axis lies between 0° and −90°. Lead II sits at +60°, perpendicular to −30°: if the QRS in II is positive, the axis is between 0° and −30° (normal); if negative, it is beyond −30° (left axis deviation).
Step 3: refine with the isoelectric lead
Find the limb lead where the QRS is most equiphasic. The axis is perpendicular to it; pick the direction that agrees with the positive leads. For example, an equiphasic aVL (−30°) with a positive lead II places the axis near +60°.
Main causes of axis deviation
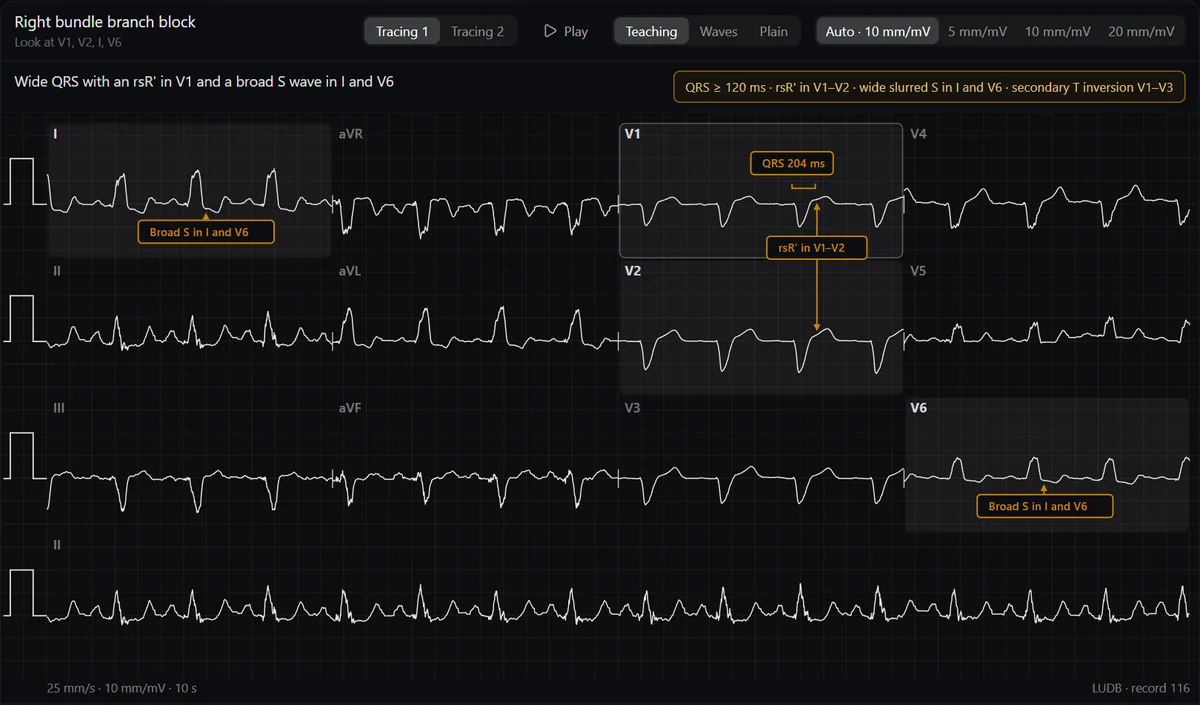
| Left axis deviation (< −30°) | Right axis deviation (> +90°) |
|---|---|
| Left anterior fascicular block | Left posterior fascicular block |
| Inferior myocardial infarction | Lateral myocardial infarction |
| Left ventricular hypertrophy (sometimes) | Right ventricular hypertrophy |
| Ventricular pacing, some pre-excitation | Acute right heart strain, such as pulmonary embolism |
| Normal in children and some thin young adults |
Always rule out limb lead reversal first: a negative P, QRS and T in lead I with an upright aVR is more often swapped arm electrodes than dextrocardia.
Study it in RadioAnato AI
RadioAnato AI, the DecodeMed app, puts 3D anatomy, CT and MRI studies, histology slides and an AI tutor that answers on them in your pocket. Free to download for iPhone, iPad and Android.
Practise
Estimate the axis on every ECG you read and compare it with the measured value. The ECG atlas shows the axis measured on each real tracing, so you can check yourself. Axis is step 3 of how to learn ECG from scratch.
Frequently asked questions
What is the normal ECG axis?
About −30° to +90° in adults. Some references extend the upper limit to +100°.
What is the fastest way to calculate the axis?
Look at the QRS in lead I and aVF. Both positive is normal; I positive and aVF negative needs lead II to decide; I negative and aVF positive is right axis deviation.
What causes left axis deviation?
Most often left anterior fascicular block, inferior myocardial infarction, left ventricular hypertrophy or ventricular pacing.
Get RadioAnato AI, the DecodeMed app
Anatomy, radiology and histology in one app, on the App Store and Google Play.
About RadioAnato AI