How to Learn to Read an ECG From Scratch: A Step-by-Step Guide
By the DecodeMed Team9 min read
Get the RadioAnato AI app, free:App StoreGoogle PlayAbout RadioAnato AI
To read an ECG from scratch, learn three things in order: what each wave means electrically, how to measure on the paper, and one fixed reading sequence (rate, rhythm, axis, intervals, P, QRS, ST, T) that you apply to every tracing. Then read real ECGs every day until the sequence is automatic.
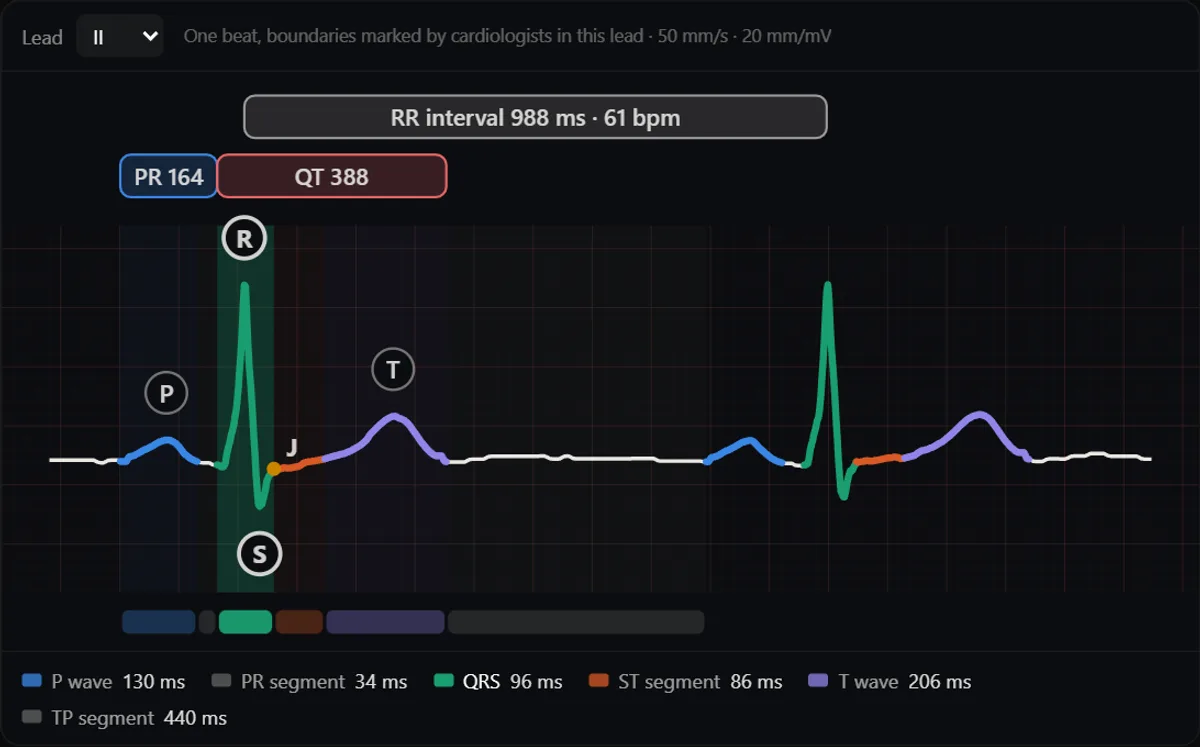
Step 1: understand what each wave is
Every deflection is the heart’s electrical activity seen from one direction. Memorising shapes without this is why many students freeze in front of a tracing.
- P wave: atrial depolarisation, starting at the sinus node.
- PR interval: from the start of P to the start of QRS; mostly the delay in the AV node.
- QRS complex: ventricular depolarisation. Q is the first negative deflection, R the first positive, S the negative after R.
- J point and ST segment: the end of QRS and the plateau before repolarisation; normally at the baseline.
- T wave: ventricular repolarisation. QT interval: from the start of QRS to the end of T.
Step 2: learn to measure on the paper
| On the paper | Equals (at 25 mm/s, 10 mm/mV) |
|---|---|
| 1 small square (1 mm) wide | 0.04 s (40 ms) |
| 1 large square (5 mm) wide | 0.20 s (200 ms) |
| 5 large squares | 1 second |
| 1 small square tall | 0.1 mV |
| Calibration pulse | 10 mm tall = 1 mV |
Check the speed and the calibration pulse before anything else: a tracing at 50 mm/s or half gain changes every measurement.
Step 3: read every ECG in the same 8 steps
- 1. Rate: 300 divided by the large squares between two R waves, or count QRS in 10 s and multiply by 6. See how to calculate heart rate on an ECG.
- 2. Rhythm: is there a P before every QRS and a QRS after every P? Are the RR intervals regular?
- 3. Axis: look at QRS in lead I and aVF. See how to calculate the ECG axis.
- 4. Intervals: PR, QRS width and QT (corrected for rate).
- 5. P wave: shape and size, best seen in II and V1.
- 6. QRS: pathological Q waves, voltage, R-wave progression across V1–V6, bundle branch block patterns.
- 7. ST segment: elevation or depression, and in which leads.
- 8. T wave: inversion, peaking or flattening, and whether it matches the QRS.
Typical normal values for each step are in the normal ECG: waves, intervals and values.
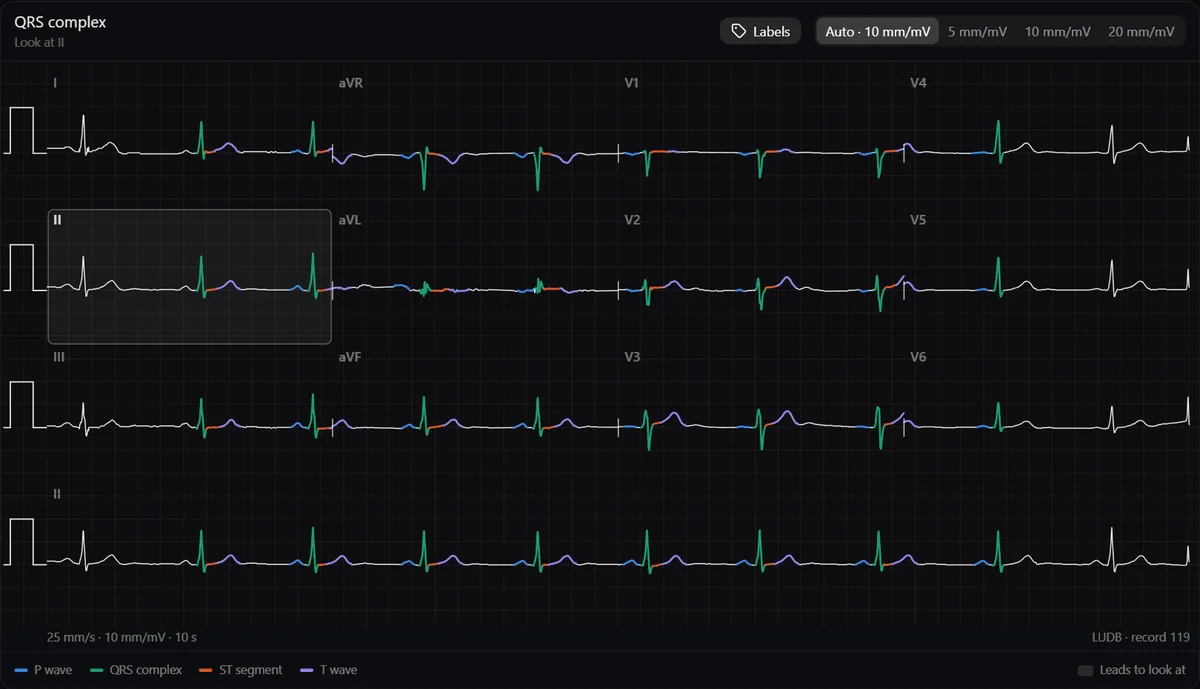
Step 4: learn the leads as views of the heart
- II, III and aVF look at the inferior wall.
- I, aVL, V5 and V6 look at the lateral wall.
- V1–V2 look at the septum, V3–V4 at the anterior wall.
- aVR looks into the cavity, so its waves are normally negative.
This is what turns an ST elevation in II, III and aVF into “inferior infarction”. Seeing the heart in 3D next to the tracing makes it stick.
Study it in RadioAnato AI
RadioAnato AI, the DecodeMed app, puts 3D anatomy, CT and MRI studies, histology slides and an AI tutor that answers on them in your pocket. Free to download for iPhone, iPad and Android.
Step 5: practise on real tracings
- Start with normal ECGs until you can describe one without hesitating.
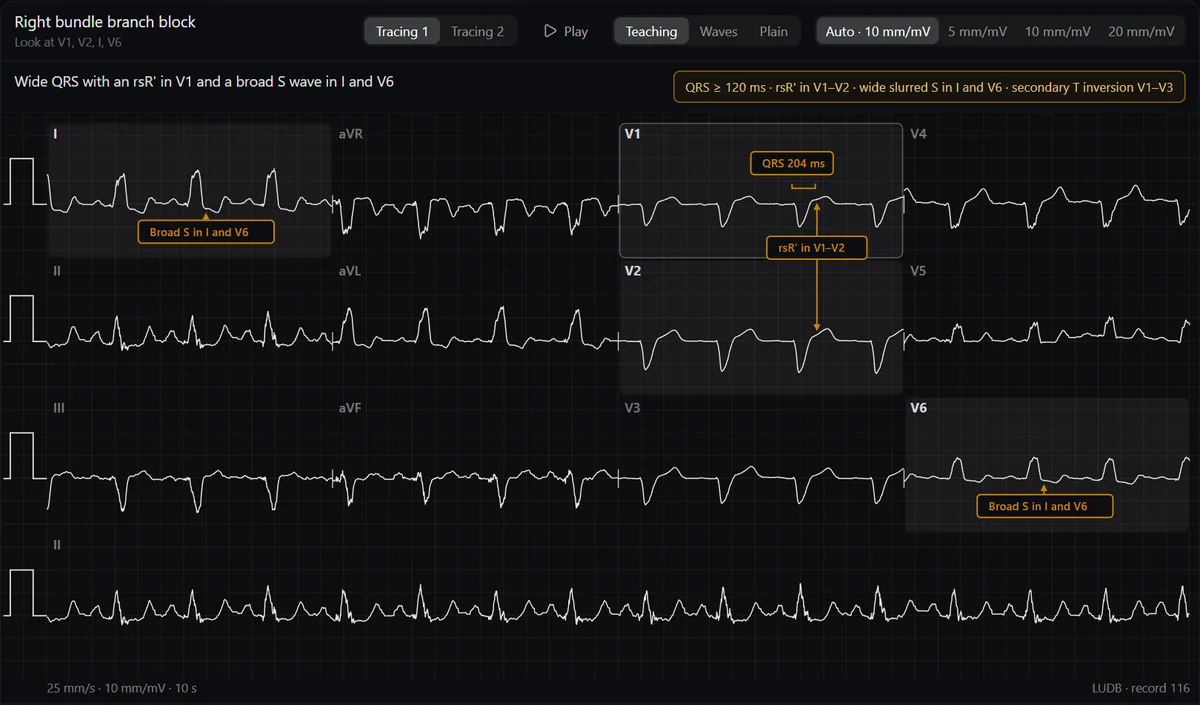
- Then one pattern at a time: sinus rhythms, atrial fibrillation and flutter, AV blocks, bundle branch blocks, ischaemia and infarction.
- Learn with the answer shown, then test with it hidden. The ECG atlas has a Teaching view with arrows on what changes and a Plain view without anything.
- Ten ECGs a day for a few weeks beat any marathon. Use practice cases with answers.
Common beginner mistakes
- Jumping to the diagnosis before measuring the rate, rhythm and intervals.
- Forgetting to check the paper speed and calibration.
- Calling every T inversion ischaemia: it is normal in aVR and often in III and V1.
- Reading a single lead: patterns are defined by groups of leads.
Tools to practise are in the best apps to learn ECG, and books in the best ECG books.
Frequently asked questions
How long does it take to learn to read an ECG?
Most students can read a normal ECG systematically after a few weeks of daily practice. Recognising arrhythmias and infarction patterns confidently takes months of regular tracings.
What should I learn first in ECG?
What each wave means and how to measure on the paper, then a fixed reading sequence applied to normal ECGs. Pathology comes after you can describe a normal tracing.
Can I learn ECG on my own?
Yes, with a book or course for the theory and many real tracings to practise, but check difficult tracings with a teacher.
Get RadioAnato AI, the DecodeMed app
Anatomy, radiology and histology in one app, on the App Store and Google Play.
About RadioAnato AI