How to Calculate Heart Rate on an ECG: the 300, 1500 and 6-Second Methods
By the DecodeMed Team5 min read
Get the RadioAnato AI app, free:App StoreGoogle PlayAbout RadioAnato AI
At the standard paper speed of 25 mm/s, heart rate is 300 divided by the number of large squares between two R waves, or 1500 divided by the number of small squares. If the rhythm is irregular, count the QRS complexes in the 10-second strip and multiply by 6.
Why these numbers work
At 25 mm/s one small square is 0.04 s and one large square is 0.2 s, so one minute contains 1500 small squares and 300 large ones. Dividing by the squares between two beats gives beats per minute.
Method 1: the 300 rule (large squares)
Find an R wave on a thick line and count the large squares to the next R wave: 300, 150, 100, 75, 60, 50. Fast and good enough for most regular rhythms.
| Large squares between R waves | Heart rate (bpm) |
|---|---|
| 1 | 300 |
| 2 | 150 |
| 3 | 100 |
| 4 | 75 |
| 5 | 60 |
| 6 | 50 |
Method 2: the 1500 rule (small squares)
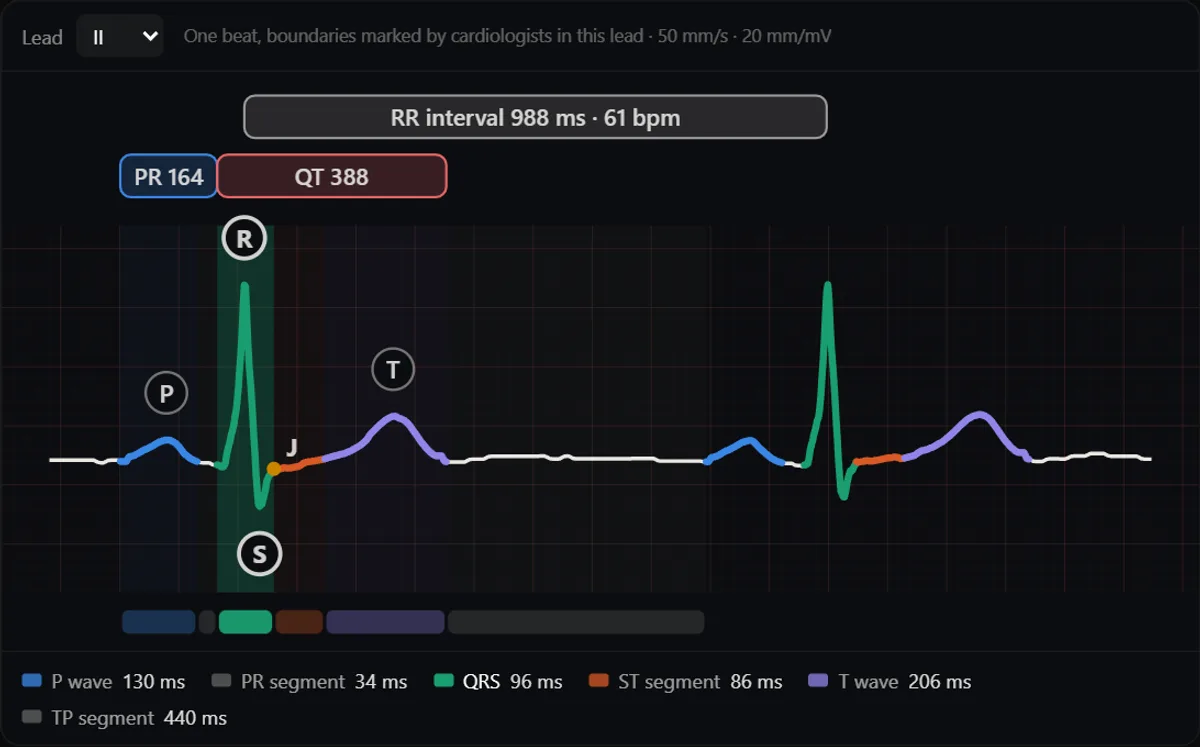
Count the small squares between two R waves and divide 1500 by that number. It is the most precise method for regular rhythms. Equivalently, divide 60,000 by the RR interval in milliseconds.
Worked example: in the beat above, the RR interval is 988 ms, about 24.7 small squares. 1500 ÷ 24.7 ≈ 61 bpm, and 60,000 ÷ 988 ≈ 61 bpm.
Method 3: count the beats (irregular rhythms)
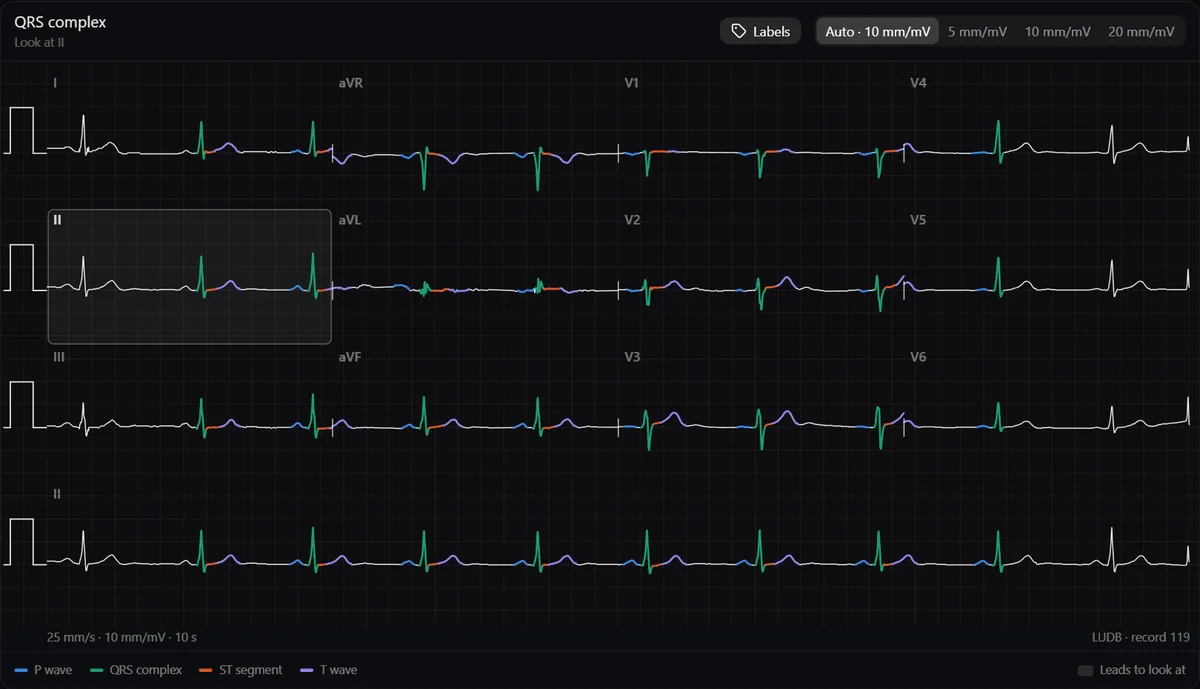
A standard 12-lead ECG lasts 10 seconds: count the QRS complexes in the rhythm strip and multiply by 6. On a 6-second strip, multiply by 10. Use this for atrial fibrillation and any irregular rhythm, where the RR interval changes from beat to beat.
Interpreting the result
- 60–100 bpm: normal range in adults at rest (some use 50–100).
- Under 60 bpm: bradycardia. It can be normal in athletes and during sleep.
- Over 100 bpm: tachycardia. Next, look at QRS width and the P waves to classify it.
- Atrial rate: in AV blocks or flutter, measure the P waves separately from the QRS.
Study it in RadioAnato AI
RadioAnato AI, the DecodeMed app, puts 3D anatomy, CT and MRI studies, histology slides and an AI tutor that answers on them in your pocket. Free to download for iPhone, iPad and Android.

Common mistakes
- Using the 300 rule on an irregular rhythm.
- Forgetting to check the paper speed: at 50 mm/s the numbers double (600 and 3000).
- Counting a tall T wave as an R wave.
Rate is step 1 of the systematic reading in how to learn ECG from scratch. Practise on real tracings in the ECG atlas, which shows the measured rate and RR interval of each one.
Frequently asked questions
How do you calculate heart rate on an ECG quickly?
Count the large squares between two R waves and divide 300 by that number: 1 square is 300 bpm, 2 is 150, 3 is 100, 4 is 75, 5 is 60.
How do you calculate heart rate on an irregular ECG?
Count the QRS complexes in the 10-second strip and multiply by 6, or in a 6-second strip and multiply by 10.
Which method is the most accurate?
The 1500 rule (1500 divided by small squares), or 60,000 divided by the RR interval in milliseconds, for regular rhythms.
Get RadioAnato AI, the DecodeMed app
Anatomy, radiology and histology in one app, on the App Store and Google Play.
About RadioAnato AI